Proof Points
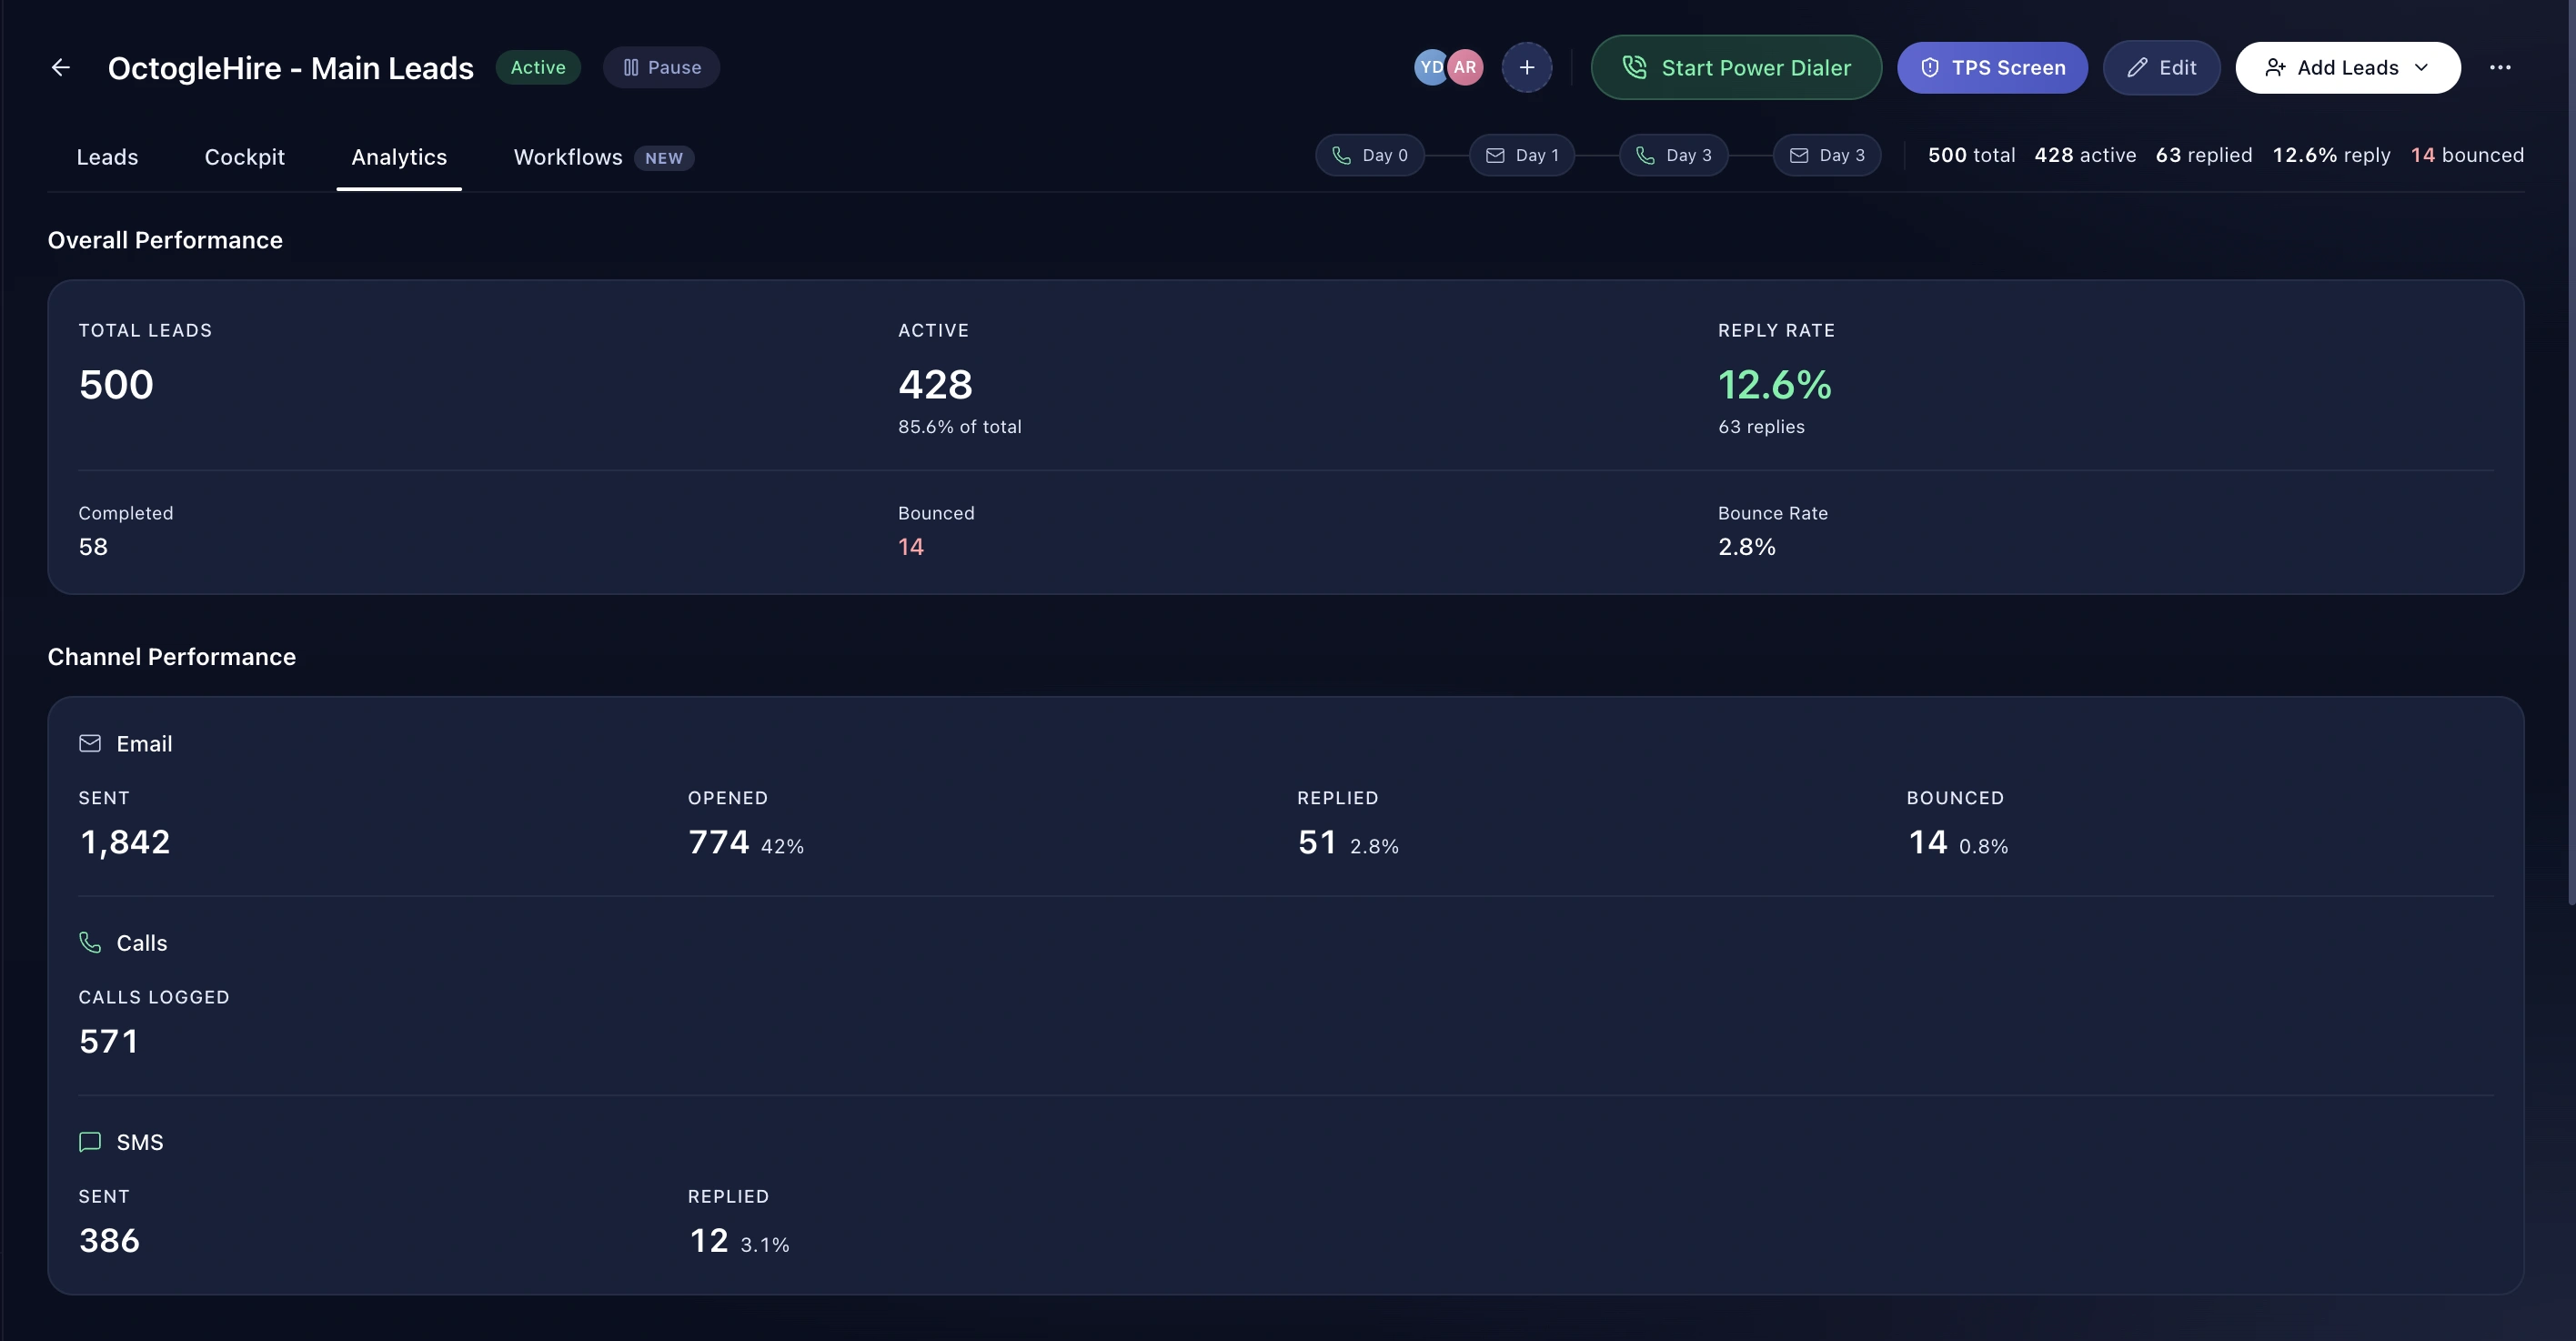
- Overall performance summary
- Step funnel chart
- Channel performance
- Source performance
- Workflow performance
- Email performance panel
How It Works
- Open a campaign
- Go to Analytics
- Read the funnel, then the channel and source breakdowns
Step funnel, channel performance, source performance and email results, per campaign.
A campaign underperforming by twenty percent is almost always one step underperforming by eighty. The funnel chart shows which.
Reply rates by channel, on the same campaign, against the same audience.
Leads from a scraper and leads from a webhook behave differently. See which source is worth more.
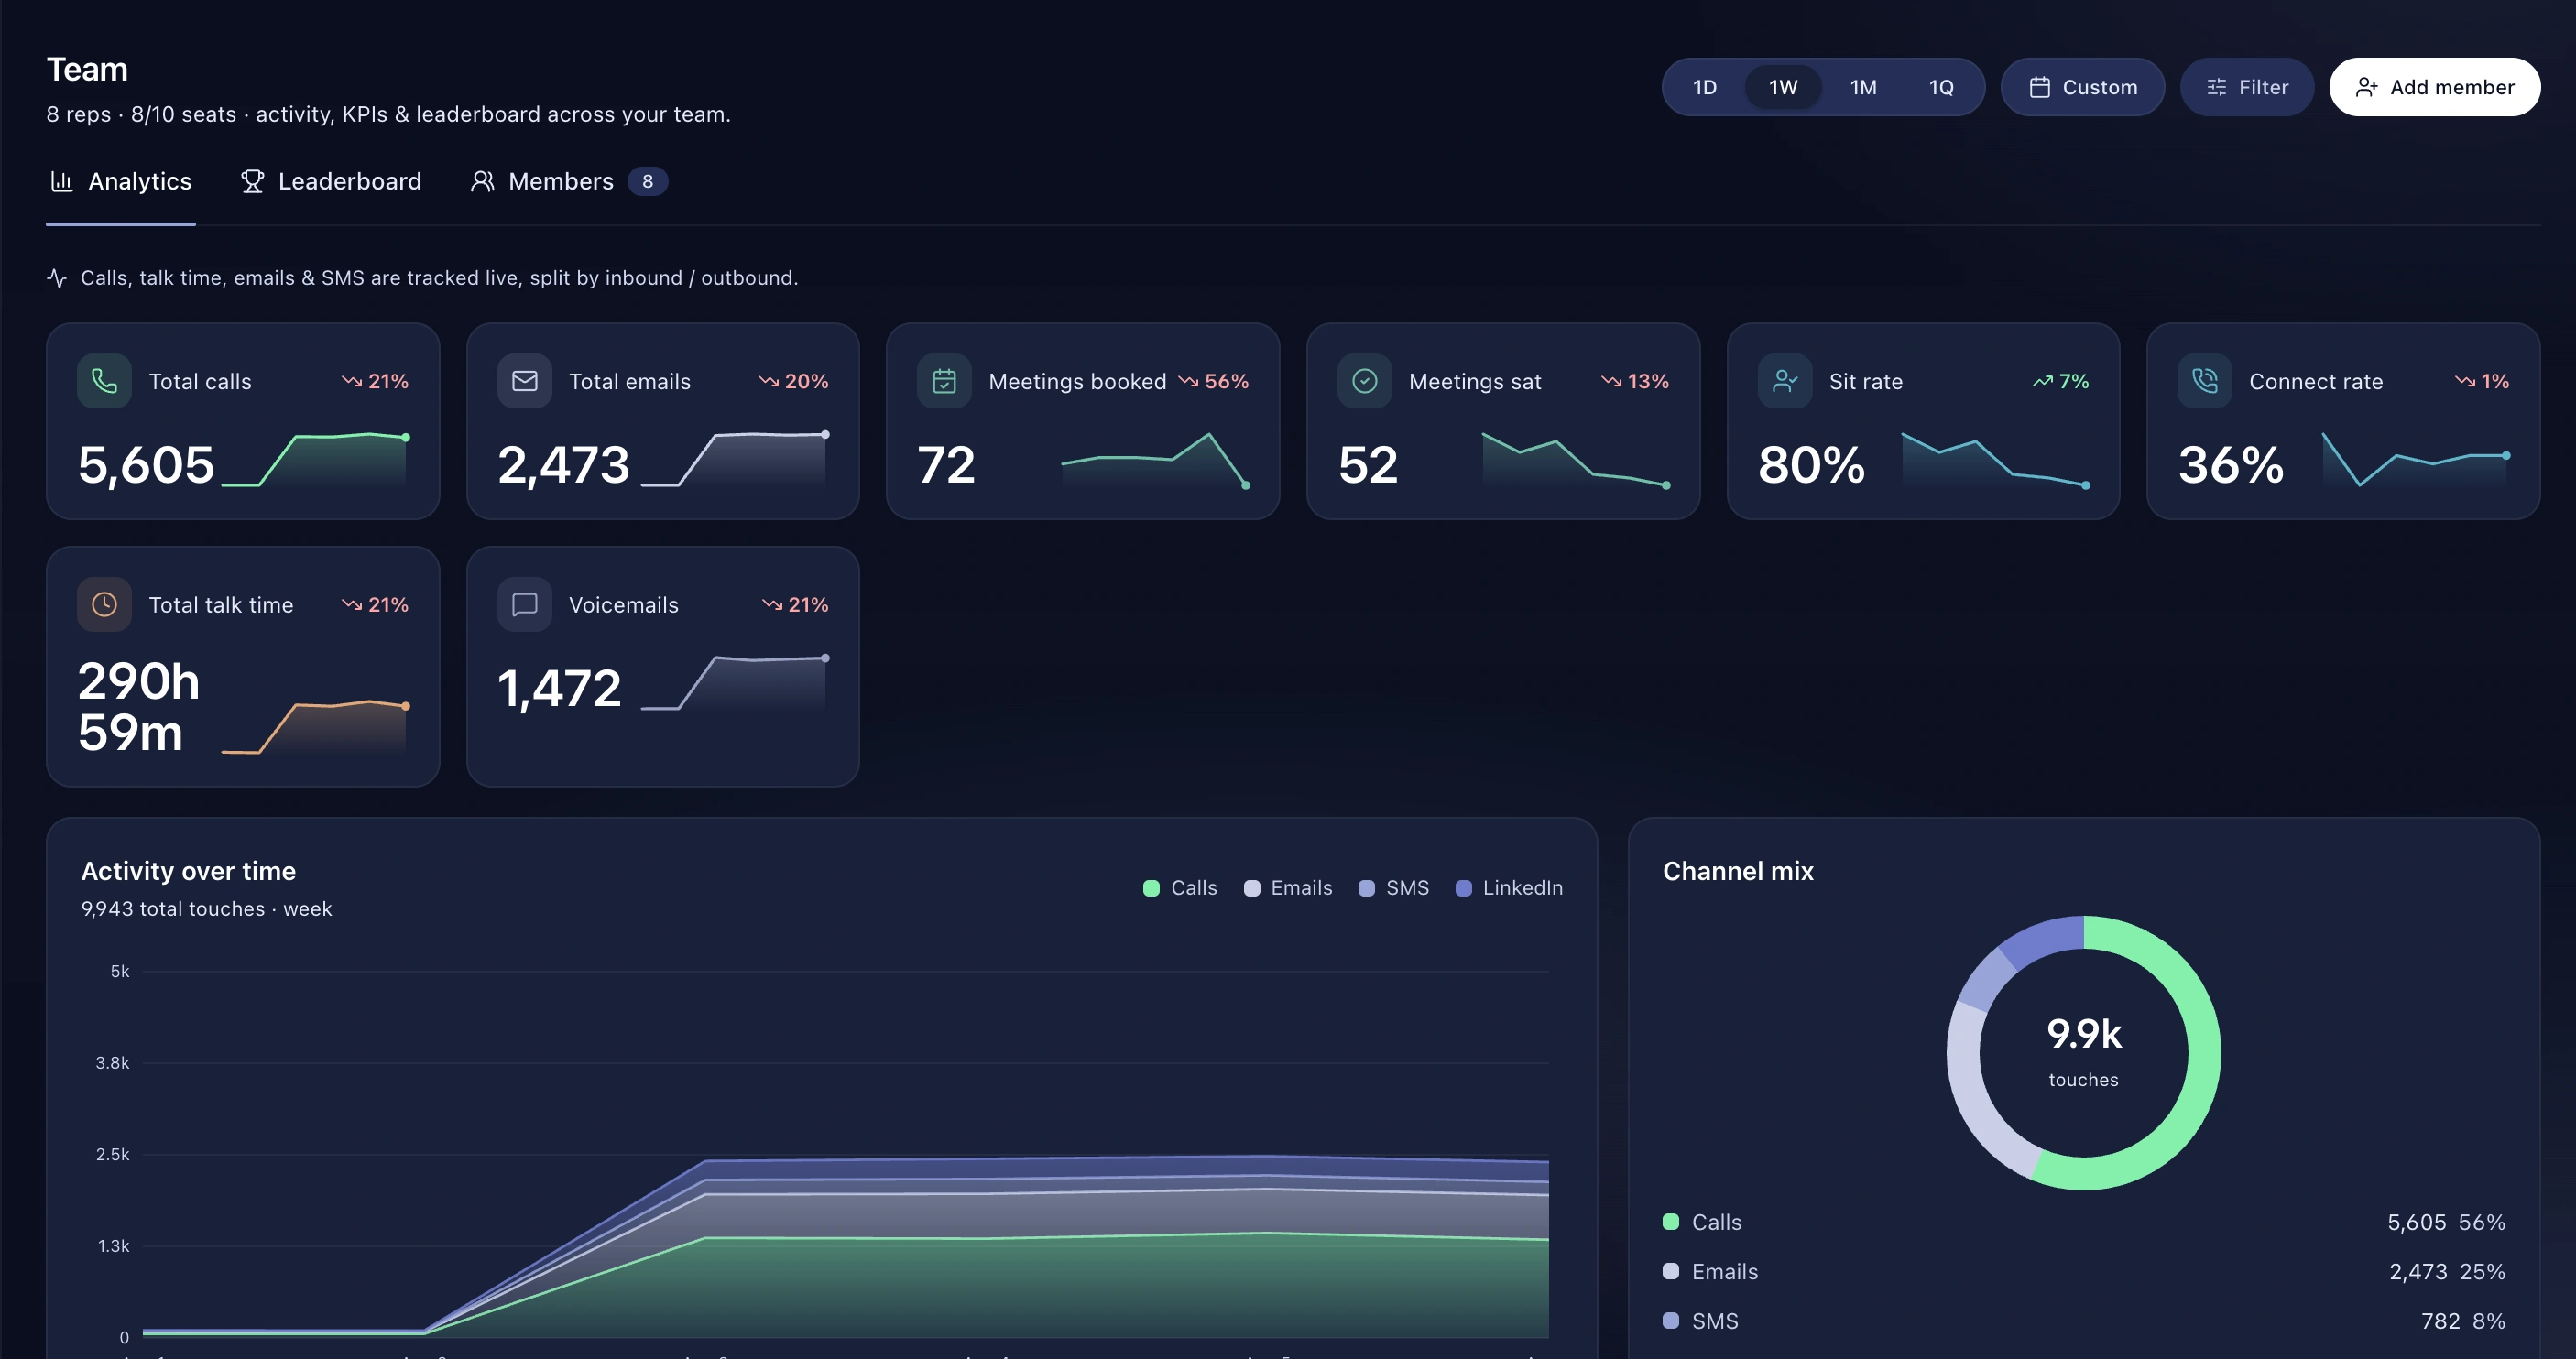
That's in Team Analytics.
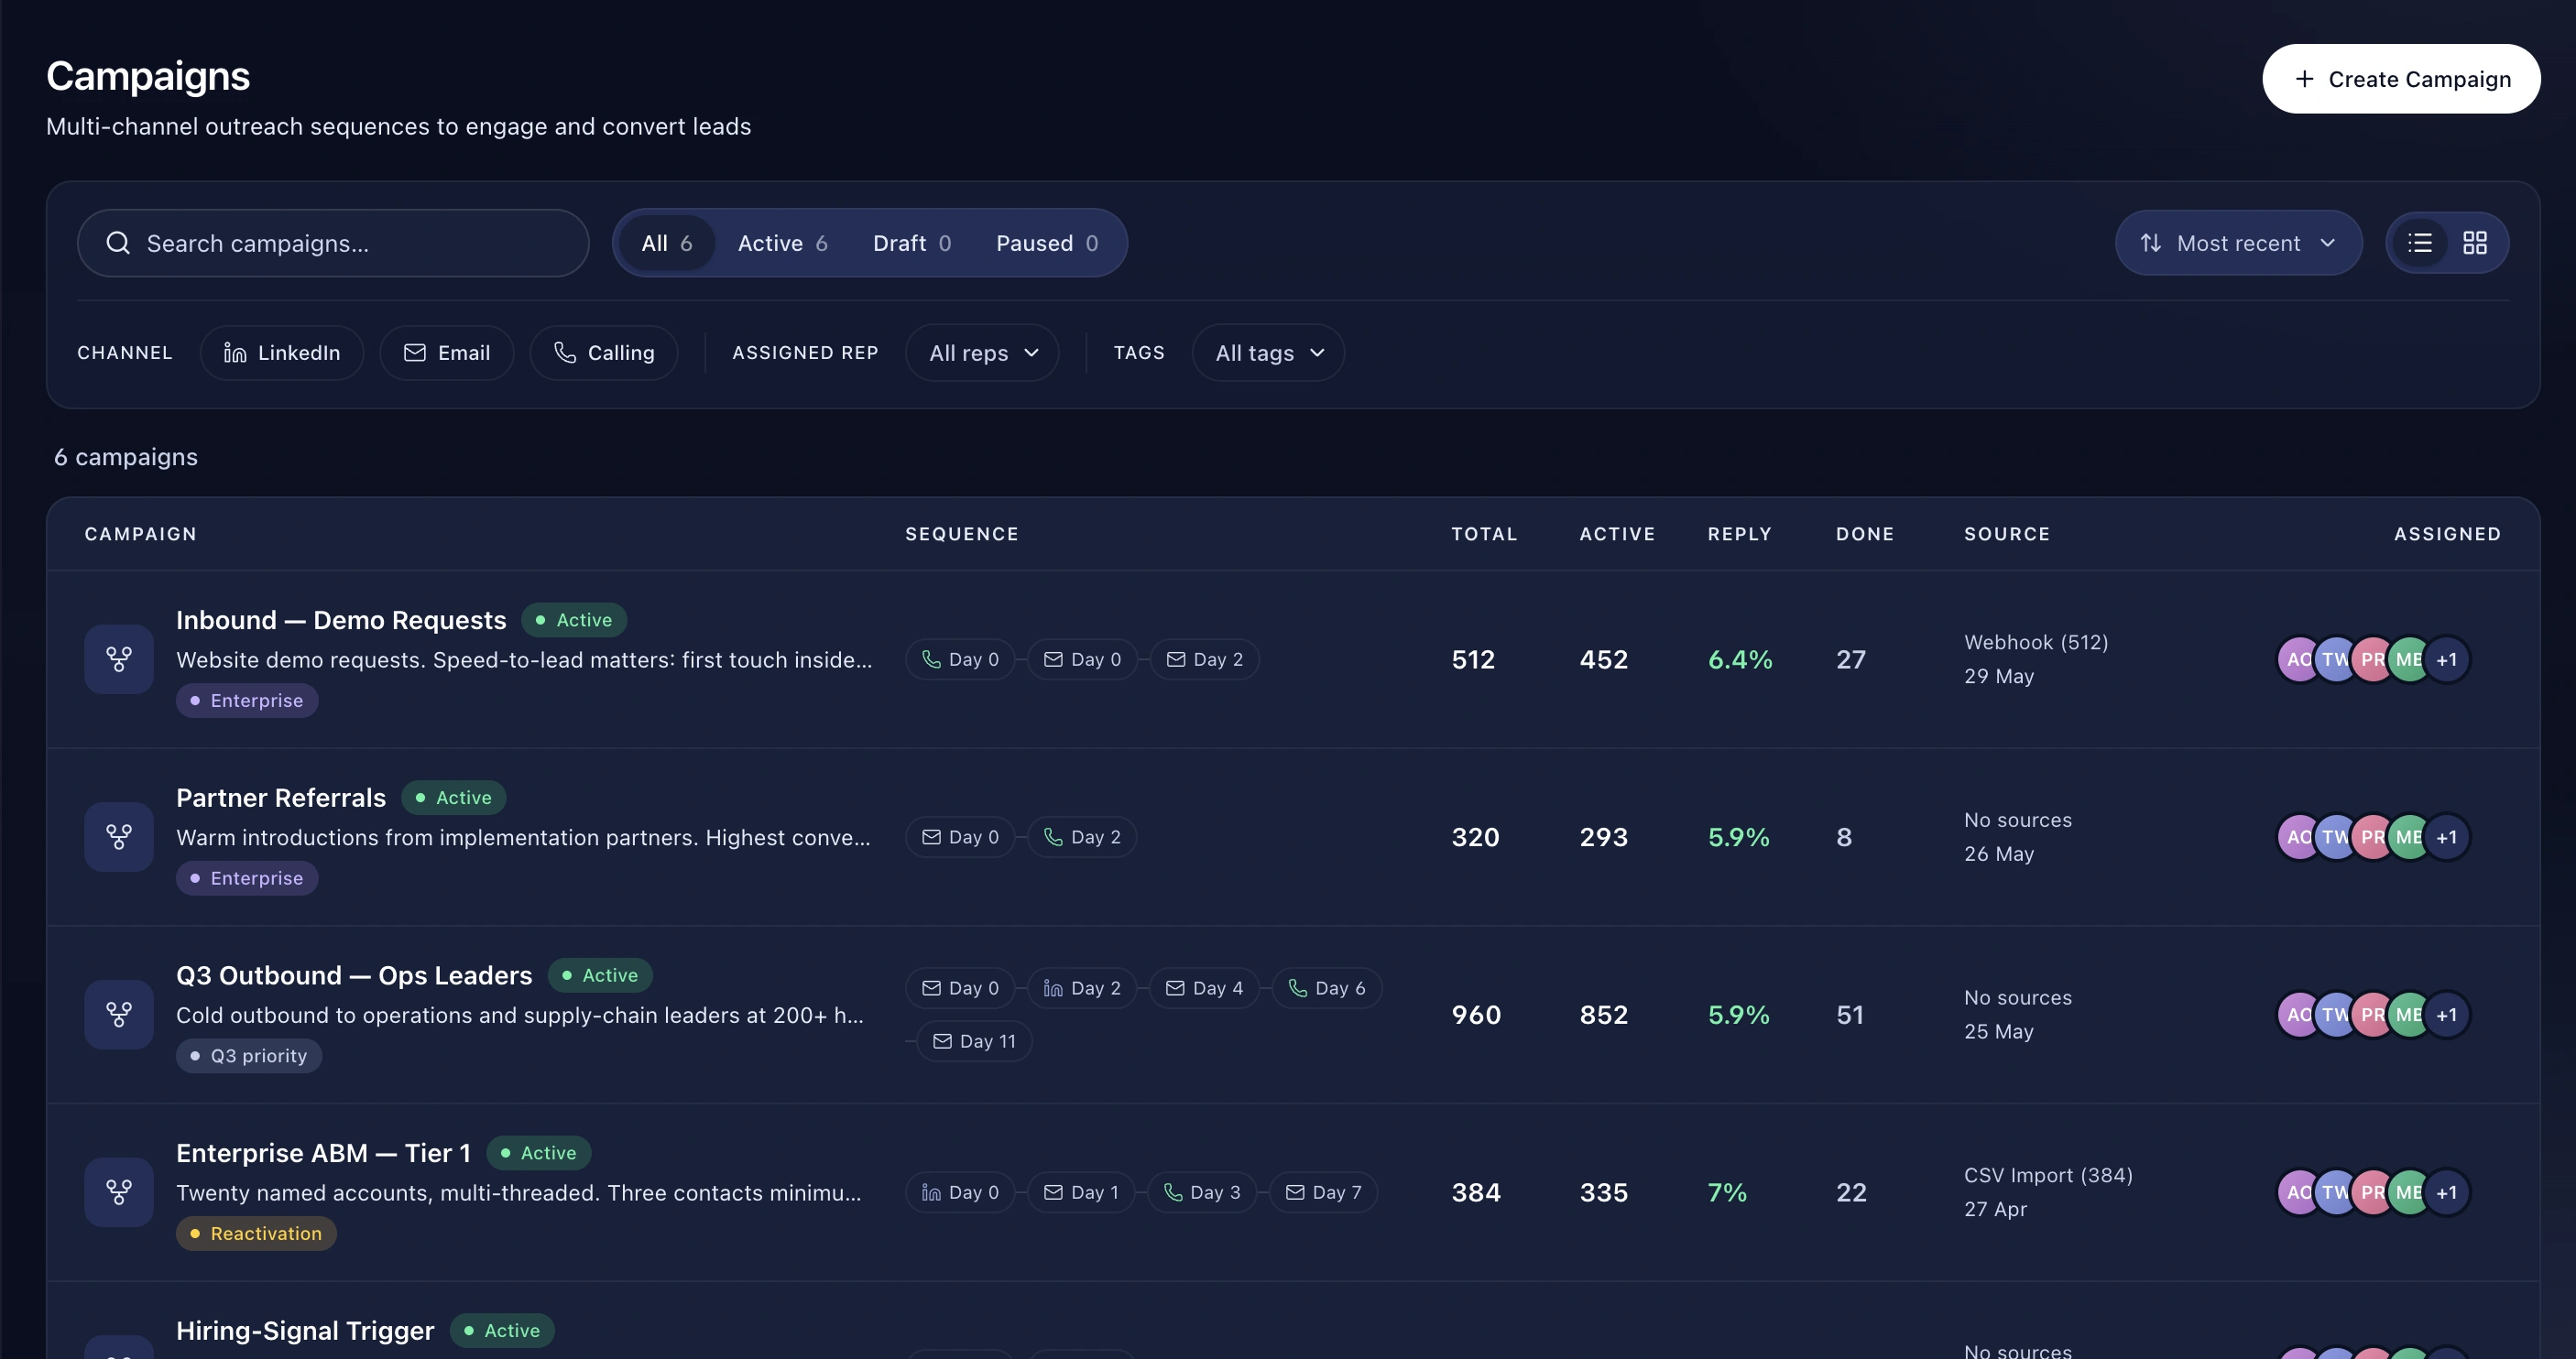
Open each one; a cross-campaign comparison view is on the roadmap.
Yes.
Explore